4.0.0 Introduction
Of the four interdependent elements of research, we have already dealt with three of them: an overview of the significance of the chosen phenomenon of interpersonal behaviour was presented in the first chapter; the relevant theories about the phenomenon were reviewed in the second chapter; and the third chapter described the method of data collection, besides other related aspects of the research design. The present chapter deals with the fourth element, namely, the statistical treatment of the data. The chapter discusses the results of the various statistical analyses that were carried out and uses the results to test the hypotheses that were set forth in the preceding chapter.
The results are discussed in nine main sections, 4.1.0 to 4.9.0. Section 4.1 discusses the descriptive statistics of the sample on each of the FIRO variables, in twelve sub-sections: 4.1.1 to 4.1.12. A broad summary of all the twelve distributions is presented in sub-section 4.1.13, by grouping the variables under Inclusion, Control and Openness.
Section 4.2 deals with the mean scores of managers and students. Section 4.3 presents illustrative profiles of managers and students; profiles of three managers are discussed in sub-section 4.3.1 and profiles of three students in 4.3.2. Section 4.4 takes up discussion of the correlation coefficients of FIRO variables, separately for managers in 4.4.1 and for students in 4.4.2. Section 4.5 deals with sub-group comparisons within managers, in its sub-sections 4.5.1 to 4.5.6. Sub-group comparisons within students are given in section 4.6.0 and its sub-sections 4.6.1 to 4.6.4. Section 4.7.0 summarises the preceding discussions and examines the tenability of the hypotheses, which were to be tested by the statistical analyses. Section 4.8 presents the results of an advanced statistical analysis, called Multiple Discriminant Analysis (MDA), in seven tables (4.8.1 to 4.8.7) and discusses them briefly. Section 4.9 is an unplanned (yet relevant) addition, discussing the concept of compatibility. After describing the measures used for the purpose in sub-sections 4.9.1 and 4.9.2, sub-section 4.9.3 presents the compatibility analysis and discusses the results.
4.1.0 Distribution of Managers and Students on FIRO ScoresThe basic data collected on the FIRO variables alone comprise 6900 terms (12*253 managers plus 12*322 students). One simple way to make sense out of such a large mass of raw data is to apply the science of descriptive statistics to it. Although an absolute frequency analysis of the distribution is considered suitable for a preliminary summarisation of raw data (Klecka, 1982), we resorted to a relative frequency (percentage) analysis so as to be able to compare, readily and with ease, the two given samples of unequal size. The following subsections discuss the relative frequencies of managers and management students, with respect to their scores on each of the twelve FIRO variables.
4.1.1 Distribution on Perceived-Expressed InclusionThe percentage distributions of managers and students on the Perceived-Expressed Inclusion (PEI) scale are shown in Figure 4.1.1. It is observed that the highest percentage of managers (20.6%) have scored 5 on this variable, while a similar majority of students (20.5%) have scored 4. That is, the modal score of managers is 5 and that of students is 4. At the right end of the scale, it is noted that the high-scoring managers (with scores of 7, 8 and 9) are slightly more in number(25%), compared to the students of the category (24%), whereas the reverse is seen to be the case (5% of managers and 7% of students) with respect to the low scores of 0 and 1, at the left end. Such a phenomenon is possibly indicative of a higher felt need for socialising in the managers than in the students. This interpretation can, however, be checked for its tenability by further analysis, to be done later in the chapter. Right now, we shall only take a cursory look at what the Figures present to our eyes.
4.1.2 Distribution on Perceived-Expressed ControlFigure 4.1.2 depicts the distributions of managers and students on the Perceived-Expressed Control (PEC) scale. The modal value of students is seen to be 0, scored by 21 per cent, followed by score 1 by 13 per cent of the students. Thus, 34 per cent of the students score less than 2. It is also seen, at the other end of the scale, that only small minorities of students (cumulatively 10%) score 8 and 9. While both the distributions (managers and students) display negative skewness, the slope is steeper for the students than for the managers. Though to be verified by further analysis, the Figure indicates that, while both the groups perceive themselves to be rather powerless at present, the students see themselves as exerting very little influence on others. One might readily attempt to explain this phenomenon of the students' perceived powerlessness by referring to their position in life as having no opportunity to exercise control. But this explanation wouldn't hold water against the observation that about 35 per cent of the students score above the mid-point of the scale, indicating that these students do exercise a good degree of control. Some of this control is often expressed in terms of influencing "public" opinion aimed at certain changes in the curriculum, such as having additional electives mounted, increasing the registration limits on CISs (Course of Independent Study), acquiring the required resources for recreational activities, etc. Lack of opportunity, therefore, is not the reason. Could it be that the "powerless" majority (those with a PEC score of 4 or less) is uninterested in expressing control? This question can be examined when discussing the WEC scores, later in the chapter.
4.1.3 Distribution on Perceived-Expressed OpennessAs regards the distributions of managers and students on the FIRO scale of Perceived-Expressed Openness (PEO), Figure 4.1.3 appears slightly skewed to the left for both the groups. Large proportions of managers (62.45%) as well as students (62.12%) seem to be wary of being open (having a score of 4 or less) in their interpersonal relationships. These PEO profiles of the respondents do not seem to augur well, for mutual openness or self-disclosure has been found to play an important role in the development and maturity of interpersonal relationships (Levinger & Snoek, 1972; Jourard, 1959).
4.1.4 Distribution on Wanted-Expressed InclusionFigure 4.1.4 on Wanted-Expressed Inclusion (WEI) shows positive skewness for both the groups, indicating that a lot many of the managers as well as students want to be highly sociable. Their desire to socialise is much higher than what currently obtains. About 80 per cent of managers and 77 per cent of students score more than 4 on WEI, whereas the corresponding percentages on PEI are 60 and 52. Such a high wanted-expressed inclusion, coupled with a low propensity to PEO (as seen in 4.1.3, above), may result in social get-togethers at a superficial level of interpersonal relations. Let us wait and see whether there is a commensurate desire to increase expressed openness (WEO) or not.
4.1.5 Distribution on Wanted-Expressed ControlThe distributions on Wanted-Expressed Control (Figure 4.1.5) show a fairly clear positive skewness both for managers and students, suggesting that large proportions of managers as well as students want to exercise high control. Interestingly, students wanting to do so very strongly (scoring 9) outnumber managers (by 5%), as seen in the right extreme pair of bars. While about five per cent of the managers and six percent of the students do not want to exercise control over others at all, 21 and 26 per cent of them, respectively, want to do so to the highest degree. Cumulatively, about 73 per cent of both the groups scored 5 or more points on this scale, indicating a high desire to exercise control over others. Recalling the distribution on their current exercise of control (re-view Figure 4.1.2), one finds that there is a wide-spread desire among the managers and students to reverse their control behaviour from its presently low or moderate levels to a much higher level.
4.1.6 Distribution on Wanted-Expressed OpennessThe Wanted-Expressed Openness (WEO) variable shows an almost normal distribution of both the groups (see Figure 4.1.6). The proportion of managers and students wanting to be less or more open in their relationships with people are so distributed that a relatively small number of both of them would prefer to be minimally open, another small number wants to be highly open, and a big majority wants to operate on a mid-range degree of openness. The general drift of the distribution suggests that there is quite a degree of caution (though well spread across the scale) with regard to the openness dimension of interpersonal relations among managers and students. The comment on the probable shallowness of interpersonal relations that was made at the end of our discussion of WEI (4.1.4, above) seems warranted.
4.1.7 Distribution on Perceived-Received InclusionThe phenomenon of being included, visited or invited by others to join in social activities is addressed by the Perceived-Received Inclusion (PRI) variable. The proportion of students (about 60%) who perceive themselves as uninvited by others is larger than that of the managers (52%) who perceive themselves so (Figure 4.1.7). As one moves to the right of the figure, one notices that the managerial bars rise higher (save for the exception of score 7) than those of the students. The relative frequencies on PEI (initiating social behaviour, 4.1.1 above) also show a higher incidence of inclusion among managers than students, suggesting that there is more socialising among the managers than among the management students. The difference in the nature of work performed by the two groups might account for the difference in the social behaviour of students and managers. Given the structural constraints of their management education, the students probably cannot allow themselves much time to socialise, while, in the case of managers, socialising may be facilitated both by the demands of the job as well as the absence of an externally imposed time-table, bearing associated sanctions. Or is it that students do not enjoy socialising as much as managers might? A look at the WRI distribution, later in the chapter, may help answer this question.
4.1.8 Distribution on Perceived-Received ControlPerceived-Received Control (PRC) refers to the degree of one's being controlled, directed or influenced by others. Although the distribution in Figure 4.1.8 is near normal, it is interesting to note that more managers (57%) are subjected to external controls (scoring higher than 4) than students (47%). The pressing demands and insistent directions from the elected board members (who are the employers of the managers) and from other politicians, in addition to the formal rules and regulations of the organisations, may give rise to this phenomenon, whereas the students are by far subject only to the stable rules and regulations within the Institute. The percentage of students perceiving external controls on them, though smaller than that of the managers, is fairly high by itself (47%). Coming from various sub-cultures of the country and having to do a tightly packed and highly regulated residential programme (which leaves not much room for socialising), the students may perceive the atmosphere to be highly controlling, as reflected in their high score on PRC.
4.1.9 Distribution on Perceived-Received OpennessFigure 4.1.9 shows the distributions of managers and students on Perceived-Received Openness (PRO), i.e., on how far they see others as being open with, or confide in, them. The distribution of students on this variable is definitely skewed to the right, while the managers seem to fall in a near-normal distribution, indicating that more students receive a great deal of openness from their colleagues than do managers from theirs. Comparing this distribution with that of PEO in Figure 4.1.3 above, it is noted that, both among the managers and among the students, being open to others (PEO) is less than receiving openness from others (PRO). This trend is more pronounced among the students than among the managers. Obviously, such a trend in either group creates a paradox and makes it appear incomprehensible: If, in one and the same given group, most people are not open to others and yet say that they receive a lot of openness from others, where do these others spring from?
Some comprehensibility of the above phenomenon might be sought in the fact that all people are open with others, but vary only in the degree to which they do. Viewed in the light of this fact, the rest of the phenomenon is a matter of perception. A person may, as a function of his own needs, overvalue the openness coming to him from others. People see what they want to see. Perception can distort realities in favour of one's needs and desires. (One may at this juncture like to take a peek at the WRO distribution). Experimental psychologists have noted, for example, that hungry subjects tended to see more and more of the ambiguous figures as articles of food, as the subjects' hunger increased (Murphy, et al., 1943; McClelland, et al., 1948). It has also been noted in experiments that poorer children tended, in their perception, to magnify the size of coins significantly more than children of well-to-do parents did (Bruner & Goodman, 1947). Given this zoom-lens role of needs in perception and a high WRO (see sub-section 4.1.12), such perceptual dynamics would apply a fortiori to the observed low-PEO & high-PRO phenomenon among the students, who are yet to resolve their identity crisis, which assumes additional magnitude and complexity in an atmosphere of residential co-education. A heightened need for personal significance and intimacy in an artificial atmosphere of emotional starvation can influence perception so as to magnify the significance of what might otherwise be mere morsels of personal information or even gossip.
4.1.10 Distribution on Wanted-Received InclusionThe Wanted-Received Inclusion (WRI) scale shows distinctly right-skewed distributions (Figure 4.1.10), suggesting that a great majority of managers (70%) and even greater majority of students (73%) want very much (score above mid-point) to be included in or invited to the company of others for socialising. The observations made in the context of PEI and PRI above gave rise to a possible question of whether students had a lower liking for mixing and mingling with people than managers did. The question is more than adequately answered here in the negative. The students outnumber the managers in their wanting to receive high degrees of Inclusion (see the right-end of Figure 4.1.10). Given the right-skewed distributions of students on WEI in Figure 4.1.4 and on WRI in the current figure (both of which, respectively, suggest that they very much want to include and be included), their low scores on PEI and PRI can more plausibly be explained as a case of postponement of gratification, necessitated by the high-task environment, rather than as representing a lack of, or a low need for, Inclusion.
4.1.11 Distribution on Wanted-Received ControlThe distributions of managers and students on Wanted-Received Control (WRC) is neatly left-skewed, as seen in Figure 4.1.11, reflecting an intense dislike in both the groups for being directed or controlled by others. The figure also indicates that there would be more intolerance of external control among the students than managers. Their youthful optimism, their craving for independence and their self-confidence which is bolstered by a professional education, may all converge and conspire into leading the students on to loathe controls from others. Managers, on the other hand, may have learned from practical experience to recognise the need for, and even to solicit, external guidance and control. In Figure 4.1.2, the currently expressed control (PEC) also showed negative skewness, with a relative dominance of managers. The wanting-to-control (WEC) distribution in Figure 4.1.5, in contrast to those of PEC and WRC, showed a pronounced reversal of the skewness for managers as well as students. That is to say, both managers and students (particularly the latter) currently exercise little control over others and would like to increase it to an appreciable degree, but would rather reduce or eschew similar controls from others.
4.1.12 Distribution on Wanted-Received OpennessThe FIRO variable of Wanted-Received Openness (WRO) refers to the degree of one's need or desire to receive openness from those involved in one's interpersonal relationships. Figure 4.1.12 depicts the distributions of managers and management students on this variable. Overall, the distribution is right-skewed, indicating that both managers and students would like others to be highly open with them. The figure also shows that students want more of openness from partners in relationships than do managers (see the high-score end of the Figure). Contrasting the PEO distribution and, particularly, the WEO distribution with that of WRO here, the phenomenon may be described as follows: "I am not quite open and would not like to be very open with you, but I want you to be exceedingly open with me," they seem to be saying! If this indeed is the current picture, it is more pronounced among the students, for 74% of them score higher than 4 on this scale as against 63% of the managers.
4.1.13 A Summary of the DistributionsFor recapitulative purposes, Table 4.1 provides a summary of the distributions that were discussed above, but grouped cumulatively under high score (5-9) and low score (0-4) categories. Figures M1 to M3 and S1 to S3 are again summaries of the same distributions, but grouped under the three main dimensions of Inclusion, Control and Openness, and presented in the form of line graphs. It is useful to take a look at the Figures, one pair at a time (M1 - S1, M2 - S2 or M3 - S3) and refer to the corresponding variables in the Table. For example, Figures M1 and S1 portray the Inclusion profiles of managers and students, respectively, whose end-points look similar, with PEI being lower than PRI, which is lower than WEI, which is lower than WRI. The intermediate points in the profiles appear rather entangled. A look at Table 4.1 across the rows that correspond to these four Inclusion variables makes this apparent entanglement more comprehensible. Such a combined reading of these summaries can, therefore, help appreciate the profiles better. On the Inclusion profile, for instance, WEI peaks up for both managers (80%) as well as for students (77%) and PRI is the lowest for both the groups.
Since the contents of Table 4.1 and those of the summary Figures have already informed the discussions in the earlier sub-sections, they do not call for any further discussion here. It may broadly be stated from the descriptive summary that the presently expressed interpersonal behaviour of the managers is characterised most by Inclusion, followed by Control and least by Openness. Their desire to engage in these three aspects of their relationships also shows the same order of preference, indicating that the interpersonal profile of the managers in the study is like what McClelland (1975) calls the affiliative manager. The students portray a profile that appears affiliative, too; but it is not as prevalently so as in the case of the managers.
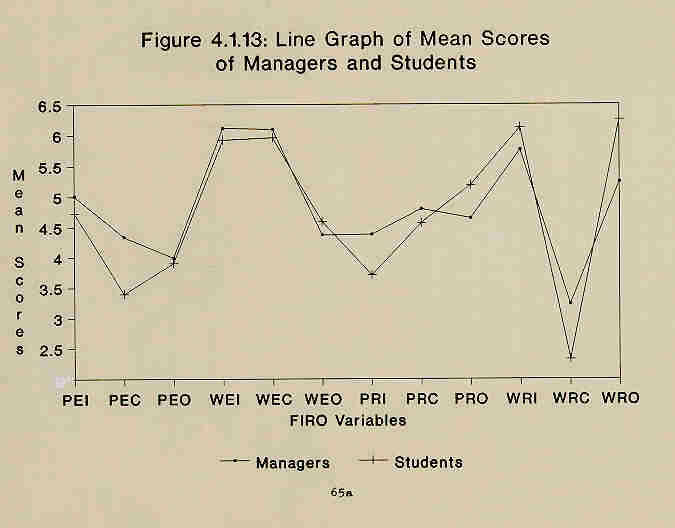
4.2.0 Mean Scores of FIRO VariablesThe foregoing section described the frequency distributions of managers and students on each of the FIRO-variable scores. While these descriptive statistics did indeed help to capture certain aspects of the population behaviour on the variables, the analysis left the actual values of the raw scores untouched. A frequent way to measure the size of the actual terms (the raw scores) in a group as well as compare the sizes of the terms in two or more groups is to compare their means (Weinberg & Schumaker, 1962). Mean values and standard deviations of the scores on the twelve FIRO scores were, therefore, computed for managers and students. Figure 4.1.13 presents line graphs of the mean scores. Tables 4.2 to 4.4 present the mean scores, along with their t-ratios. The means, standard deviations and the inter-variable t-ratios (paired t-test) for the managers are presented in Table 4.2 and those for the students in Table 4.3. The inter-group t-ratios (independent t-test) for the managers and students are given in Table 4.4, along with the means and standard deviations, repeated for ready reference. The contents of these tables are discussed below. The discussion is grouped under the three basic dimensions of Inclusion, Control and Openness.
4.2.1 InclusionTable 4.2 shows a PEI mean score of 5.01, which tells us that the managers' perceived-expressed inclusion behaviour is fairly high at present; that is, they exhibit a fairly high degree of initiating social behaviour with others. The mean score of 6.12 for WEI informs us that the managers want to significantly (p<.001) increase their expressed inclusion behaviour from its already-high present level (see t-ratio for PEI and WEI in Table 4.2). The managers' initiatives at inclusion seems to be reciprocated inadequately and they wish it were much more than it is at present. This interpretation is based on the observation that their PRI mean (4.38) is lower than their PEI mean of 5.01 and their WRI mean (5.76) is higher than both (the differences are significant at p<.001). While the managers want more reciprocation from others than they receive at present, they would like to initiate more social behaviour themselves than the increased inclusion they want from others (the WEI-WRI t-ratio is positive and significant at p<.01).
The trend of the inclusion variables is the same as above for the students, except for two differences: one, the PRI of students (Table 4.4) is significantly lower (p<.01) than that of managers, meaning that the students perceive a greater deficit of inclusion from others than do managers; two, while managers (Table 4.2) want their expressed inclusion (WEI) to be significantly higher than what they want to receive (WRI) from others, the students (Table 4.3) want the reciprocity to be mutually high and at par (their WEI and WRI means do not differ significantly).
Comparing the above results with those of the descriptive statistics discussed in the previous section, the earlier interpretation that managers are more sociable than students (section 4.1.1 above) is not tenable; they do not differ in their perceived-expressed inclusion.
4.2.2 ControlAccording to Table 4.2, the managers as of now exercise only a medium level of control (PEC mean = 4.34) and want to raise it significantly (WEC mean = 6.10; p<.001). They also perceive themselves being directed too much for their liking; their PRC-WRC difference is positive at p<.001. The WEC-PRC and WEC-WRC differences are also positive at p<.001, meaning that the managers want to reduce the extent of their being controlled and enhance their active control.
The perceived-expressed control of students (PEC = 3.4) is significantly lower than that of managers (p<.001), as is obvious from Table 4.4. This means that students exercise less control on others than managers do. The two groups do not differ significantly in their PRC and WEC (Table 4.4). That is to say, the students perceive themselves as much directed and controlled by others as the managers do and they want to increase their control over others as much as the managers want to. Thus, our apparent hesitation and tentativeness in section 4.1.8 about the difference between the managers and students on the PRC variable may be cast away now: the difference is not significant and, therefore, it can be maintained that the students experience as much external control as managers do, though the sources of such control may be different, as surmised in the earlier discussion. As regards wanted-received control (WRC), the students would tolerate much less of it than the managers seem willing to (p<.001).
4.2.3 OpennessManagers are only moderately open (PEO = 4.0) in their interpersonal relationships at present, but express a desire to be a little more open (WEO = 4.37). They also find others moderately open with them (PRO = 4.64); though both PEO and PRO are moderate, the managers perceive others (subordinates?) as being more open with them than the managers themselves are or want to be with others. They also want others to be yet more open than at present (WRO = 5.24). All these mean scores differ from one another at p<.001 (Table 4.2).
The students do not differ from the managers (Table 4.4) in the degree to which they are (PEO) or want to be (WEO) open in their relationships with others; the scores for both the groups are moderate and their difference is not significant. But their PRO score of 5.19 is significantly higher than that of managers (p<.01), meaning that the students receive more openness from others than the managers do. The openness they want from others (WRO = 6.25) is also significantly higher than what the managers want (5.24); the difference is at p<.001.
4.3.0 Profile AnalysisWhile the distribution of a sample on each of the variables studied may indicate the general behaviour of the population, profile analysis of representative elements from the sample is often the apt method to elicit any natural configuration of variables in specific individuals (Likert, 1967).
People differ in their orientations to other people (Horney, 1945; Schutz, 1984). We could examine our data for such differences in general orientations, if we had an overall measure of people orientation in our sample. For this purpose, therefore, a derived measure of interpersonal-orientation strength was obtained in this study by aggregating each subject's FIRO scores. Subjects with a total score equal to or less than 36 constituted the FIRO-Low group, those with a total of 37 to 72 formed the FIRO-Medium group and those scoring a total of more than 72 were in the FIRO-High group. One subject from each of these groups was randomly picked for purposes of plotting the profiles.